
1.4. Vibrational Spectroscopy (Raman & FTIR)
Lattice Vibrations
Technique
Raman and Fourier-transform infrared spectroscopy (FTIR) both measure vibrations associated with chemical bonds and crystal lattices. FTIR measures infrared absorption, while Raman measures inelastically scattered laser light. Because they follow different selection rules, a vibration that is weak in one technique may appear strongly in the other.
In carbon-coated LFP, FTIR is particularly useful for examining phosphate stretching and bending modes, while Raman can probe both the LFP structure and the carbon coating through the D and G bands. For NCM, Raman is commonly used to assess the local layered-oxide structure, whereas FTIR is more useful for identifying surface residues, coatings and interfacial species. Together, the techniques can reveal bonding changes, disorder and minor species that may be difficult to distinguish using XRD alone.
Observation
Characteristic vibrational modes - are bands sharp and well-defined?
Peak shifts and broadening: Do they indicate changes in composition, oxidation state, local strain, disorder or phase structure?
Organic residues - are unreacted precursors, moisture, carbonates or other processing residues present? In finished electrodes, expected binder and conductive-additive signals must be separated from unwanted residues.
“Vibrational spectra serve as fingerprints of structural stability. Band shifts or broadening reveal internal stress that may affect performance”
NCM v LFP
NCM: A₁g and Eg Raman modes (480–600 cm⁻¹). Changes in their position, width or intensity can indicate structural disorder, changes in oxidation state or degradation. These changes should be checked alongside XRD, XPS and electrochemical testing.
LFP: Strong PO₄³⁻ stretching (950–1050 cm⁻¹). Stable peak positions and shapes are consistent with a well-preserved olivine framework, while XRD is still needed to confirm the bulk crystal structure.
Impact on Cell KPIs
Changes in vibrational peaks can reveal structural disorder, phase changes or altered carbon chemistry that may contribute to higher resistance, reduced rate capability and faster capacity fade. Raman and FTIR therefore provide useful screening evidence, but cell testing is needed to quantify the effect on performance and lifetime.
Worked example: Assessing LFP Phosphate Structure with FTIR and Carbon Coating with Raman
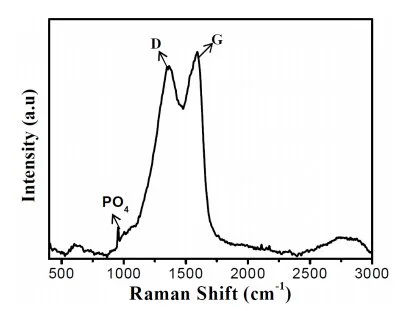
Figure 1. Raman spectrum of carbon-coated LiFePO₄/C prepared using urea-assisted combustion, with sucrose used as the carbon source, followed by heat treatment at 600°C. The x-axis, Raman shift (cm⁻¹), identifies different vibrational modes, while the y-axis, intensity (a.u.), shows their relative signal strength.
The small peak near 940 cm⁻¹ is associated with symmetric stretching of the PO₄³⁻ group in LFP. The broad D and G bands near 1350 and 1590 cm⁻¹ arise from disordered and more graphitic forms of carbon, respectively. The reported ID/IG ratio of approximately 0.92 indicates significant disorder within the carbon structure. The carbon bands dominate the spectrum, making some of the weaker LFP vibrations less visible.
Note: Raman supports the presence of LFP-related phosphate vibrations and provides information about carbon structure, but it does not by itself confirm bulk phase purity, carbon-coating thickness or coating uniformity.
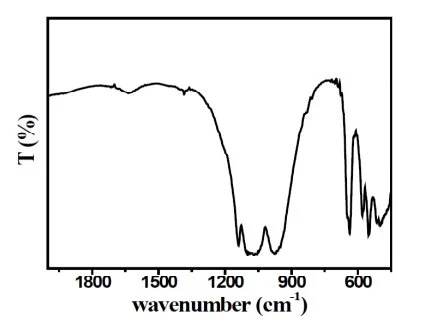
Figure 2. FTIR spectrum of the same carbon-coated LiFePO₄/C material after heat treatment at 600°C. The x-axis, wavenumber (cm⁻¹), identifies the vibrational energy, while the y-axis, transmittance (%), shows how much infrared light passes through the sample. Because this is a transmittance spectrum, the downward features represent infrared absorption bands.
The bands between approximately 940 and 1140 cm⁻¹ are associated mainly with P–O stretching, while those between approximately 530 and 640 cm⁻¹ arise mainly from O–P–O bending. These characteristic phosphate vibrations are consistent with the expected local PO₄³⁻ framework of LFP.
Note: FTIR provides supporting evidence that the phosphate framework has formed, but XRD is still required to confirm the bulk olivine crystal structure and assess crystalline secondary phases.
The two techniques provide complementary information. FTIR resolves the phosphate framework more clearly, while Raman provides the clearest information about the carbon coating surrounding the LFP particles.
Key observations
- Raman shows an LFP phosphate vibration near 940 cm−1.
- Broad carbon D and G bands appear near 1350 and 1590 cm−1, consistent with the carbon coating.
- The reported ID/IG ratio is approximately 0.92, showing that the coating contains mainly disordered rather than highly graphitic carbon.
- FTIR shows the expected phosphate stretching bands at approximately 940–1140 cm−1 and bending bands at approximately 530–640 cm−1.
- Together, the results are consistent with carbon-coated LFP containing the expected phosphate framework.
What to look for
- Raman and FTIR phosphate bands in the expected positions for LFP.
- Clear, repeatable spectra across different samples and production batches.
- Raman D and G bands consistent with the intended carbon coating.
- A broadly consistent ID/IG ratio between comparable batches measured using the same method.
- No strong unexplained bands from contamination, residual precursors or secondary species.
- XRD, TEM and bulk carbon analysis used alongside Raman and FTIR for confirmation.
Red flags
- Missing, strongly shifted or unusually broad phosphate bands → possible structural or chemical differences.
- Unexpected Raman or FTIR bands → possible contamination, residual precursors or secondary phases.
- Large changes in the D and G bands between batches → inconsistent carbon formation or heat treatment.
- Strong moisture, carbonate or organic-residue signals → possible storage or processing issues.
- Using ID/IG as a universal quality score → the result depends on the measurement and analysis method.
Why it matters
- The phosphate framework is central to LFP’s structural and thermal stability.
- Unwanted phases or incomplete phosphate formation can reduce usable capacity and energy.
- The carbon coating improves electronic transport and supports rate capability and power performance.
- Poorly controlled carbon can increase cell resistance and cause inconsistent active-material utilisation.
- Residual species or surface contamination can contribute to capacity fade and resistance growth.
- Consistent spectra support reliable cycle life, manufacturing quality and batch-to-batch performance.
Edited by Muthu Krishna